
Guide
How to Use Statistics in PackLite
Analyze gear usage patterns and pack weight trends over time.
What You Will Do
This guide explains how to use the Statistics dashboard to understand your packing patterns. See which gear you use most frequently, track weight trends across your trips, identify underused items, and discover ways to optimize your load.
Before You Start
- You are logged in to PackLite.
- You have at least one trip in your account.
Step 1 - Open Statistics Dashboard
Navigate to Statistics to view your gear analytics.
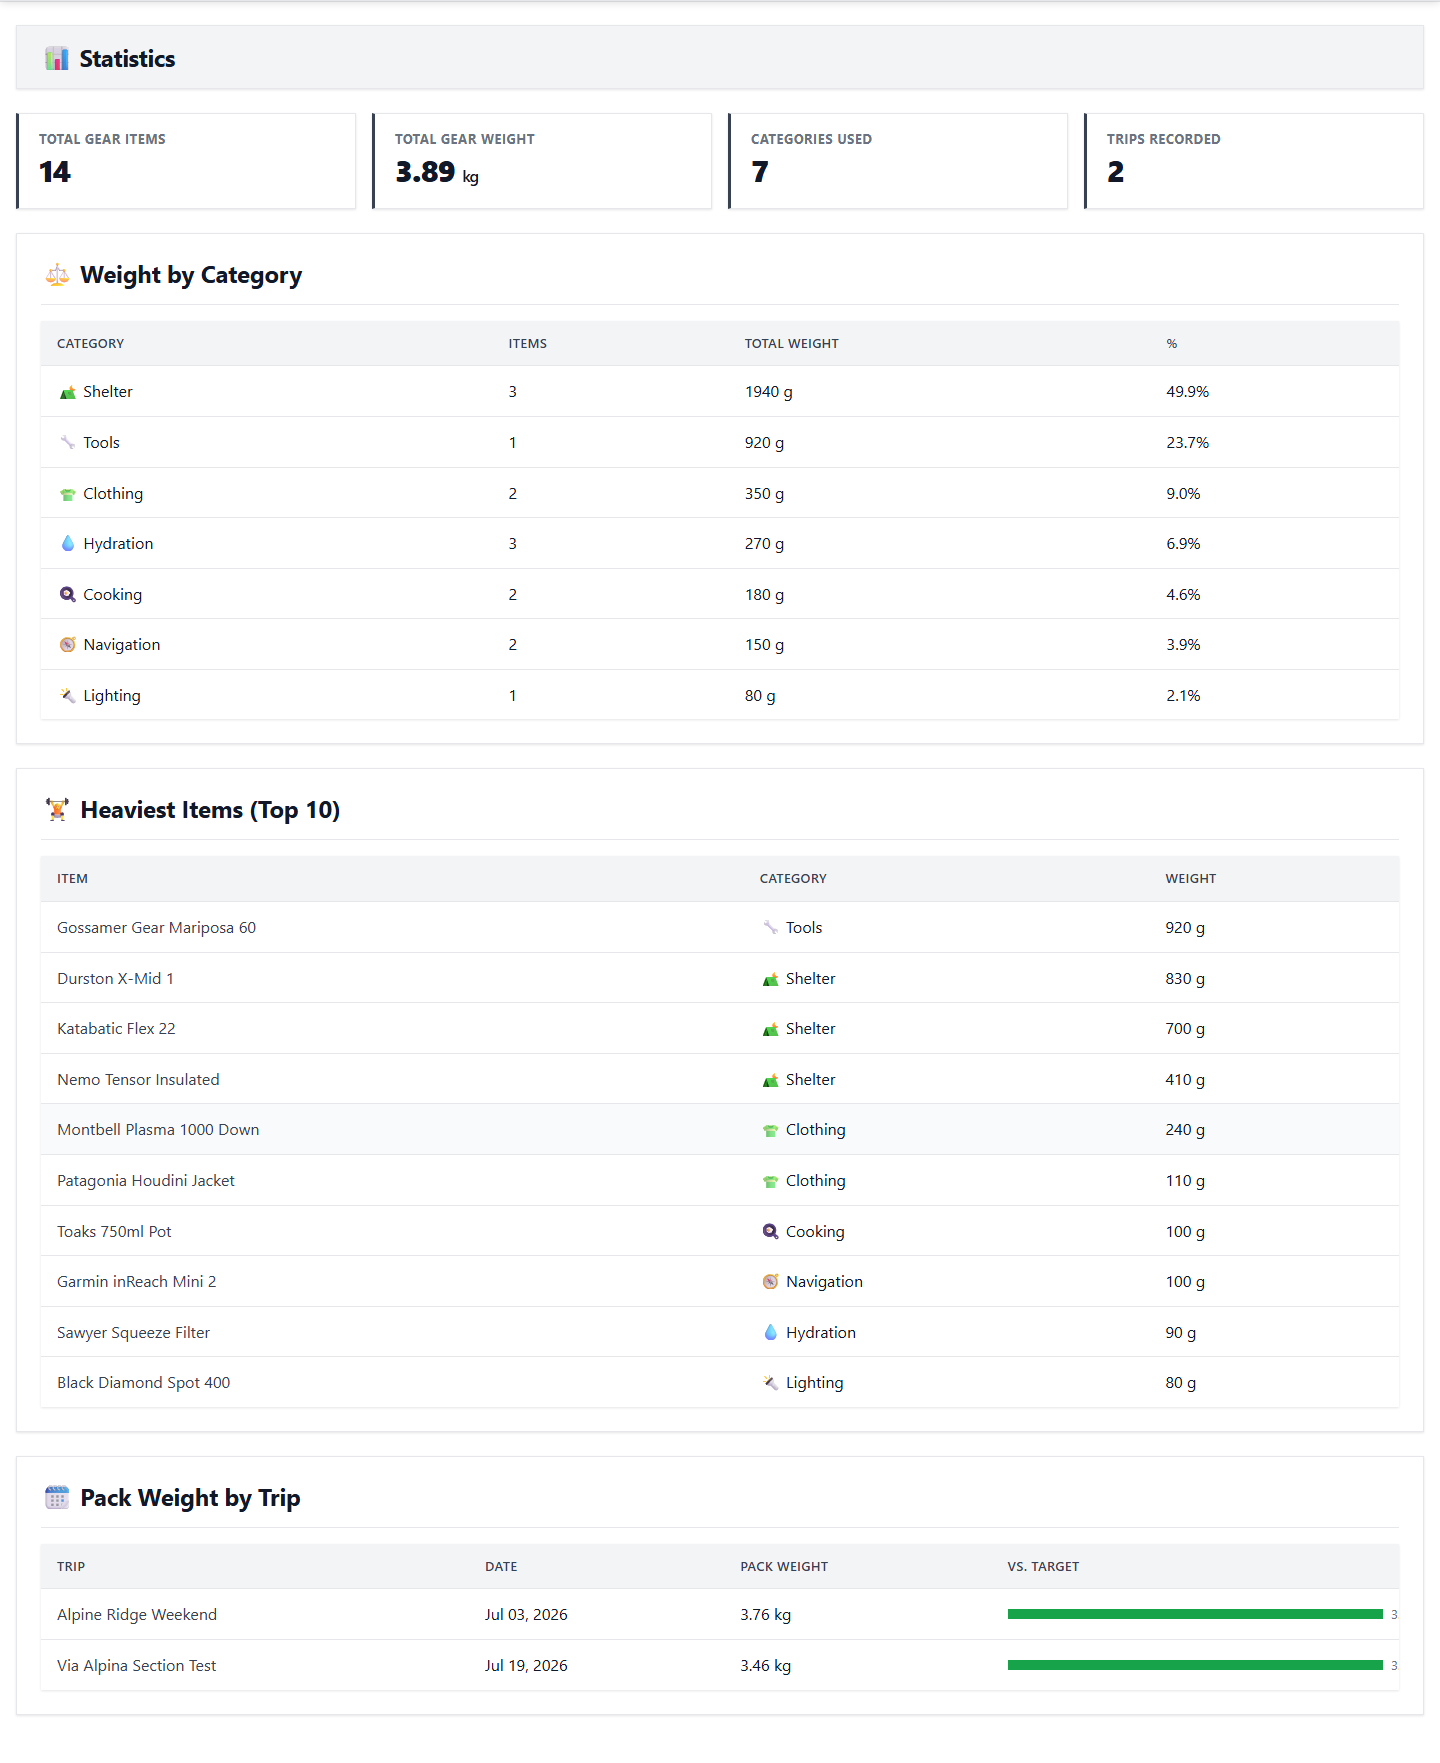
Tip: See your gear usage frequency, weight totals, and trends here.
After Completion
- You understand your gear usage patterns.
- You can see which items are essential vs. rarely used.
- You can identify trends in your pack composition.
- You can make data-driven decisions to optimize your packs.
Troubleshooting
- No statistics data: Statistics update after you complete a trip.
- Inaccurate usage data: Make sure you mark items as used during trips for accurate usage data.
- Weight statistics incorrect: Weight statistics are based on the gear items in each trip.